Fact: ~27% of car trips are under 3 miles …
… and in 2017, ~60% were less than 6 miles.
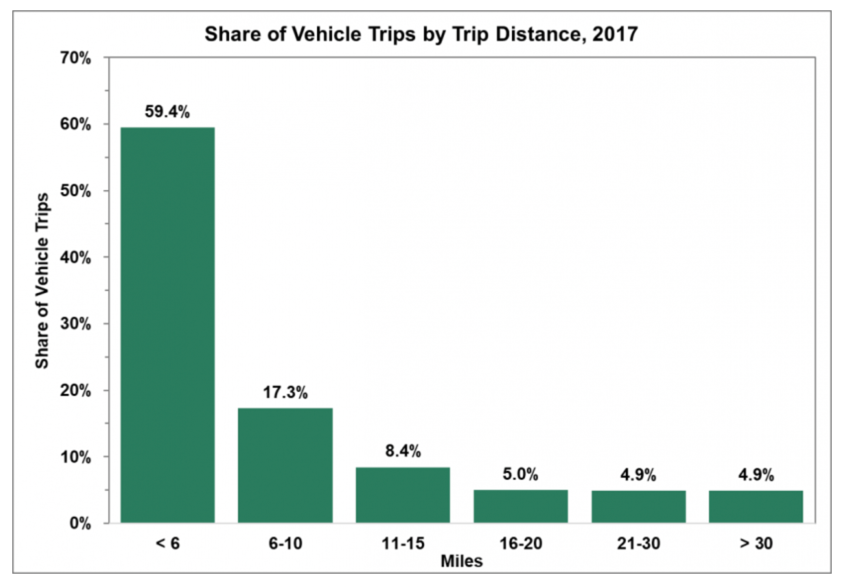
From the data in the FHWA funded National Household Travel Survey we see how infrequent long car trips really are.
| Trip distance | % of trips |
|---|---|
| Less than 0.5 miles | 3.8% |
| 1 mile | 12.6% |
| 2 miles | 11.3% |
| 3 miles | 10.7% |
| 4 miles | 7.5% |
| 5 miles | 5.8% |
| 6 - 10 miles | 19.7% |
| 11 - 15 miles | 9.8% |
| 16 - 20 miles | 6.0% |
| 21 - 30 miles | 6.0% |
| 31+ miles | 6.9% |
| Unknown | 0.0% |
Many car trips are short local drives that are well within biking distance especially when the growing popularity of e-bikes is factored in.
Source: FOTW #1042, August 13, 2018: In 2017 Nearly 60% of All Vehicle Trips Were Less than Six Miles